|
The following is reprinted by permission from 21st Century Obstetrics Now! (David Stewart, PhD, and Lee Stewart,
CCE, Editors), National Association of Parents & Professionals for Safe Alternatives in
Childbirth, 1977. (p. 387)
The 1977 NAPSAC Conference, as well as the one in 1976, depicts the growing concern among concerned individuals and organizations
that technological approaches to childbirth obscure the basic principles of preventive obstetrical and pediatric care. The
underlying consensus among those who contributed to NAPSAC's publication Safe Alternatives in Childbirth (NAPSAC, 1976), which
resulted from the 1976 conference, was that until hospitals and other medical institutions begin to fulfill the needs of those
they are established to serve, those dedicated to making childbirth a safe, healthy, and joyous family-oriented experience
must unite and remain organized. NAPSAC has provided the forum crucial to the dissemination of information and advocacy of
uncomplicated childbirth. As NAPSAC's president profoundly stated, "The outcome of birth is only in the hands of the obstetrician
and the hospital staff for a short while; but the outcome of birth remains with the parents and the child for life." [1]
As hospitals and physicians become more inclined to take advantage of the recently developed (but not proven safe) medical
technologies, such as elaborate laboratory testing, oxytocin challenge tests, fetal monitoring, amniocentesis, sonargrams,
and other devices, principles of patient care become more oriented to the convenience of the hospital staff and that of the
doctors than to the health care needs of the pregnant woman. Automated childbirth is threatening the lives and health of
thousands of pregnant women and their newborns in our nation. Will obstetrics of the future be characterized by "the drama
of instrumented babies under plastic bubbles kept alive and restored to health by space-age medicine?"[2] Will "many births
in the near tomorrow...take place in a setting of blinking lights, green glowing cathode-ray screens, dials and wires and
tubes,"[2] or will those who recognize the inherent risks of such space-age obstetrics be able to channel medical advancements
into family-centered preventive care?
Because many physicians have not learned to correctly interpret readings from the modern electronic machines, the rate of
cesarean section has increased dramatically in many areas. Trained in techniques to monitor abnormal childbirth, many physicians
apply them to innumerable instances of normal pregnancy, thereby converting the normal to abnormal. Premature delivery caused
by over-zealous use of these modern devices can affect the newborn's health deleteriously.
The pyramiding effect of automated perinatal care, besides presenting dangers to the health of the mother and baby, camouflages
some basic, physiologic processes of pregnancy and childbirth. The concept of primary prevention of complications of pregnancy
and delivery and prevention of neonatal abnormalities through sound prenatal nutrition has been supplanted by secondary prevention,
which consists of elaborate intensive care nurseries which electronically monitor premature babies, many of whom would have
been normal size at birth. The relatively new specialty of neonatology (or perinatology), with its emphasis on treatment
of abnormalities (many of which would have been unnecessary had primary prevention been applied), seems to be an appropriate
addition to the medical hierarchy. The use of drugs, which are prescribed (frequently futilely) to facilitate control of
weight and/or water retention during pregnancy, and restrictive dietary regimens (e.g., low-salt and/or low-calorie diets)
are prime causes of prematurity, creating the
need for electronic gadgetry in an attempt to prevent much of the disease, damage, and death associated with prematuriy.
As hospitals and physicians become more inclined to take advantage of the recently developed (but not proven safe) medical
technologies, the principles of patient care become more oriented to the convenience of the hospital staff and doctors than
to the health needs of pregnant women.
Why is there increased utilization of fetal monitoring when studies have shown that most cases of births of children with
mental retardation, cerebral palsy, or other central nervous system impairment are not associated with complications during
labor or delivery? One physician presented data to show that 70% of all such births are not complicated during labor or delivery.[3]
Most of those that do have such labor and delivery abnormalities are likely to be caused by the same factor that led to the
disability--inadequate prenatal nutrition. As far back as 1897, Freud contested the prevailing medical theories that prematurity,
dystocia, ashyxia, and related complications were directly related to the fetal developmental disability.[4] Instead, Freud
believed the complications and disability were caused by the same developmental factor. More current studies have shown that
malnutrition frequently lies at the etiology of both the pregnancy, labor, and/or delivery complication(s) and the child's
disability.
Even the undue emphasis on labor and delivery on the part of childbirth education groups must be questioned and their ultimate
intentions reconsidered. Not only does the gestation period encompass a greater and more comprehensive period of development
than labor and delivery, but environmental (particularly nutritional) factors play a significant role in affecting the final
stages of the birth process. An analysis of Social Security recipients who had a long-term disability which afflicted them
before the age of 18 revealed that in 75% of the cases the disability originated during the prenatal period.[5] In 94% of
the cases the disability was neurological.
Automated childbirth is threatening the lives and health of thousands of pregnant women and their newborns in our nation.
Not only is fetal monitoring ineffective in reversing intrauterine growth retardation caused by malnutrition and other environmental
factors, its use has been associated with increased complications of labor and delivery in addition to higher risks of surgery.
A Department of HEW study of 483 "high risk" pregnant women who delivered at one hospital revealed the possible hazards of
the utilization of fetal monitors.[6] All of the 483 women were fitted with fetal scalp electrodes and intrauterine catheters
so that the fetal heart rate and uterine contractions could be monitored. With the use of a random selection procedure, in
approximately half of the pregnancies, controls of the monitors were disconnected without the women's knowledge. In all of
these cases, nurses monitored the fetal heartbeats without the use of electronic equipment.
The results were startling. There were two and a half more cesarean sections (40) in the electronically monitored group than
in the group monitored by the nurses (16). An even more dramatic difference was observed in postpartum infections. In the
monitored group 13% of the women experienced postpartum infections in contrast to 3.4% among the controls. In addition, pediatric
evaluations showed that the health of those children born without the use of fetal monitors was, in general, superior to that
of the monitored births. Five of the study group infants, in contrast to none of those whose births were monitored by nurses,
needed assistance to maintain breathing two minutes after birth.
Another recent but more comprehensive study also demonstrated that greater utilization of elaborate machinery is not necessarily
associated with reduced risks of complications, particularly prematurity.[7] The study analyzed nearly 300,000 births in
North Carolina, where the perinatal mortality rate is much higher among nonwhites (41.0) than whites (25.7), to determine
means of reducing the interracial difference in perinatal mortality. Neither the number of prenatal visits nor the level
of sophistication of the obstetrical and neonatal care facilities at the hospital where the child was delivered was shown
to significantly affect the perinatal mortality rate. The mortality difference was due primarily to the much higher rates
of low birth weight and prematurity among nonwhites (14.0% or the nonwhite births were of less than 35 weeks' gestation and/or
weighed less than 2001 grams (4 pounds 6 1/2 ounces) than whites, where 5.7% of the births were similarly premature or underweight).
The authors of the study concluded:
There is little likelihood that regionalized perinatal care will have an impact on the race differential in perinatal
mortality....It appears that significant control of excess perinatal mortality among nonwhites will depend on prevention of
prematurity. Since the prematurity rate for nonwhites has been increasing during the past two decades while that for whites
has remained stable, the concept of preventing prematurity assumes even greater significance...If more intensive medical care
is insufficient despite its great value for the newborn and the number of prenatal visits makes little difference, where are
we to turn?....Few can argue against programs directed toward improving nutrition and decreasing perinatal mortality.[7]
A similar report concurred that "regionalization of perinatal services" and "sophisticated hospitals" staffed by highly trained
neonatologists do not necessarily lead to an improvement in perinatal health.[8] The study showed that a marked increase
in perinatal care services did not appreciably improve the outcome of pregnancy. The author wrote: "The location of the larger
obstetrical services and the inclusion of the majority of medical teaching centers, as well as the existence of a large ratio
of specialists per unit population in this area have not been sufficient to overcome this fault of medical care (i.e., poor
maternal and infant health)." [8]
Regionalization of perinatal services and sophisticated hospitals staffed by highly trained neonatologists do not necessarily
lead to an improvement in perinatal health.
The prevailing nonchalance among health care professionals about the role of sound maternal nutrition in protecting the health
of the pregnant woman and her newborn coupled with our preoccupation with technologically advanced medical machinery, which
suppresses the concept of primary prevention, are primarily responsible for the high rates of infant and maternal mortality
in the U.S. As revealed in Tables 1 and 2, the U.S. ranks 19th among all nations in infant mortality and 14th in maternal
mortality.[9]
Note from Joy: Please note that these infant mortality rates were accurate in 1977, but they are much worse 30 years
later as of 2007 (as compared to those of other countries), when the U.S. had worse infant mortality rates than 41
other countries--even as our level of high-tech, mechanized birth is ever increasing!
See 2007-2008 Infant Mortality Rates here
TABLE 1
NATIONS WITH A LOWER INFANT MORTALITY RATE
THAN THAT OF THE U.S. IN 1973*
| |
Country
|
Mortality Rate
|
|
1.
|
Sweden
|
9.6
|
|
2.
|
Finland
|
10.1
|
|
3.
|
Papua New Guinea (1971)
|
10.2
|
|
4.
|
Norway (1972)
|
11.3
|
|
5.
|
Iceland (1972)
|
11.6
|
|
6.
|
Netherlands
|
11.6
|
|
7.
|
Japan (1972)
|
11.7
|
|
8.
|
Switzerland
|
12.8
|
|
9.
|
Panama Canal Zone
|
14.3
|
|
10.
|
Luxembourg
|
15.5
|
|
11.
|
France (1972)
|
16.0
|
|
12.
|
East Germany
|
16.0
|
|
13.
|
New Zealand
|
16.2
|
|
14.
|
Liechtenstein (1969)
|
16.7
|
|
15.
|
Australia (1972)
|
16.7
|
|
16.
|
Canada
|
16.8
|
|
17.
|
Belgium
|
17.0
|
|
18.
|
Hong Kong (1972)
|
17.4
|
|
19.
|
United States
|
17.6
|
*Infant deaths per 1,000 live births; rates apply to 1973 unless specified otherwise.
TABLE 2
NATIONS WITH A MATERNAL MORTALITY RATE
EQUAL TO OR LOWER THAN U.S. IN 1971*
| |
Country
|
Mortality Rate
|
|
1.
|
Sweden
|
0.2
|
|
2.
|
Finland
|
0.2
|
|
3.
|
United Kingdom (1972)
|
0.3
|
|
4.
|
Belgium (1970)
|
0.4
|
|
5.
|
Netherlands
|
0.4
|
|
6.
|
Czechoslovakia
|
0.5
|
|
7.
|
Denmark
|
0.5
|
|
8.
|
East Germany (1972)
|
0.5
|
|
9.
|
Canada
|
0.5
|
|
10.
|
Luxembourg (1972)
|
0.6
|
|
11.
|
Austria (1972)
|
0.6
|
|
12.
|
Bulgaria (1972)
|
0.6
|
|
13.
|
Poland (1972)
|
0.6
|
|
14.
|
United States
|
0.6
|
*Maternal deaths during pregnancy or childbirth per 100,000 females; rates apply to 1971 unless specified otherwise.
Because of our emphasis on providing elaborate intensive care nurseries equipped with modern electronic machinery and our
neglect of establishing networks to prevent prematurity and low birth weight, an international comparison of low birth weight
puts the U.S. in an even less favorable position than in the case of infant mortality. It is particularly startling that
the incidence of low birth weight (under 5 1/2 pounds) babies in the U.S. is no lower today than it was in the early 1920's.[10,11]
As Table 3 reveals, the rate of underweight births has remained fairly stabilized in the U.S.; the rate for non-whites has
increased significantly.
The U.S. incidence of low birth weight babies is 75% higher than Finland's,[12] 60% higher than Iceland's, and 25% higher
than that of Japan.[13] Our rate of underweight babies is even 16% higher than that of Britain[13] even though the U.S. infant
mortality rate is lower.[9] In the People's Republic of China, an emphasis on preventive medicine and applied research has
led to a decline in the prematurity rate to less than 3%.[14]
Trained in techniques to monitor abnormal childbirth, many physicians apply them to normal pregnancy, thereby converting the
normal to abnormal.
TABLE 3
U.S. LOW BIRTH WEIGHT INCIDENCE
(DATA NOT AVAILABLE FOR YEARS PRIOR TO 1950)
 |
|
| |
...All...
|
|
Nonwhite(1950-1967)/
|
|
Year.................
|
......Births+......
|
.....White.....
|
Black (1968-1972)*
|
|
|
|
|
|
|
1950^
|
7.5%
|
7.1%
|
10.2%
|
|
1951^
|
7.6
|
7.1
|
10.8
|
|
1952
|
7.7
|
7.1
|
11.2
|
|
1953
|
7.7
|
7.1
|
11.4
|
|
1954
|
7.5
|
6.9
|
11.4
|
|
1955
|
7.6
|
6.8
|
11.7
|
|
1956
|
7.6
|
6.8
|
12.1
|
|
1957
|
7.6
|
6.8
|
12.5
|
|
1958
|
7.7
|
6.8
|
12.9
|
|
1959
|
7.7
|
6.8
|
12.9
|
|
1960
|
7.7
|
6.8
|
12.8
|
|
1961
|
7.8
|
6.9
|
13.0
|
|
1962
|
8.0
|
7.0
|
13.1
|
|
1963
|
8.2
|
7.1
|
13.6
|
|
1964
|
8.2
|
7.1
|
13.9
|
|
1965
|
8.3
|
7.2
|
13.8
|
|
1966
|
8.3
|
7.2
|
13.9
|
|
1967
|
8.2
|
7.1
|
13.6
|
|
1968
|
8.2
|
7.1
|
13.7
|
|
1969
|
8.1
|
7.1
|
13.9
|
|
|
|
|
|
|
1970
|
7.9
|
6.8
|
13.9
|
|
1971
|
7.7
|
6.6
|
13.4
|
|
1972
|
7.7
|
6.5
|
13.6
|
|
|
|
+ Live births with known weight.
^ Excludes Connecticut and Massachusetts.
* Births other than white or black are included in col.1 (all births) but excluded from the composite of the last 2 cols for
1968-1972.
Prenatal Nutrition and Birth Weight
Nutrition has been shown to have a more profound effect on birth weight than any other environmental factor. The relationship
between nutrition and birth weight has been known for 50 years [as of 1977]. In a study conducted in the 1920's, Acosta-Sison
observed that women on poor prenatal diets were more than ten times as likely as well-fed women to give birth to a low birth
weight baby.[15] (See Table 4) As the nutritional status of the women worsened, both the maximum and average birth weights
declined.
TABLE 4
RELATIONSHIP BETWEEN PRENATAL NUTRITION
AND BIRTH WEIGHT
|
Nutritional
Status of
Gravid Women
|
# of
Women
|
% Low
Birth
Weight
|
Significance Level of
Difference with Fairly
Nourished Group
|
|
GOOD
|
63
|
3.2
|
p<.005
|
|
FAIR
|
272
|
11.0
|
- - -
|
|
POOR
|
28
|
33.0
|
p<.005
|
In a prospective nutrition study in 1937, low birth weight was eradicated among 750 women, approximately 82% of whom had exhibited
signs of nutritional deficiencies prior to pregnancy and two-thirds of whom were clinic patients.[16] The eradication of
low birth weight (in addition, no stillbirths occurred) was accomplished by increasing the women's daily nutrients well above
the recommended levels, providing nutrition counseling, and administering polyvitamin therapy. To ensure proper nutritional
intake throughout pregnancy, the consumption of five to six relatively small meals was encouraged. As the study progressed,
the author improved the diet and vitamin supplementation regimen. Recognizing the nutritional stress of gestation (which
he called the "metabolic demand in pregnancy"), he stated: "our therapeutic efforts are always directed toward improving the
general nutrition of the patient, principally from natural food sources, but also with polyvitamin therapy in sufficient dosage
to relieve the signs and symptoms."
The smallest child among the 750 well-fed women weighed 6 pounds 4 1/4 ounces (2482 grams). In contrast, among 750 control
group women, who comprised a similar population as that of those in the study group but who received neither nutrition education
nor polyvitamin supplementation, 37 (4.9%) of the infants weighed under 5 pounds (2268 grams). The probability that the difference
between the two groups in the number of infants weighing under 5 pounds at birth was not caused by the nutrition regimen is
less than one in 10 million.
Nutrition has been shown to have a more profound effect on birth weight than any other environmental factor and hundreds of
scientific studies have demonstrated that birth weight is the most accurate predictor of health and mental and physical development.
Another notable prospective study documented the relationship between nutrition and birth weight. In this study of 216 pregnancies
at Harvard University Department of Public Health, thorough dietary histories were taken of all of the pregnant women to determine
their nutritional status.[17-19] Based upon the dietary information acquired through interviews with nutritionists, women
were classified into five different groups according to their intake of calories and various nutrients. Unlike the aforementioned
study or 1,500 pregnancies, there was no dietary intervention.
As Table 5 reveals, birth weight was shown to be directly related to prenatal diet. Infants born to women who had been on
excellent or good diets weighed an average of 2 pounds 11 ounces (1219 grams) more than those born to the poorly nourished
women.
TABLE 5
RELATIONSHIP OF BIRTH WEIGHT
TO PRENATAL NUTRITION
|
Prenatal
Diet
|
Good or
Excellent
|
Fair
|
Poor or
Very Poor
|
|
Number of
Infants
|
31
|
149
|
36
|
|
Average
Birth Weight
|
8lb,8oz
(3856 g)
|
7lb,7oz
(3374 g)
|
5lb,13oz
(2637 g)
|
The level of protein intake, which paralleled the general dietary intake, was significantly related to both birth weight and
length. None of the infants born to mothers with a daily protein intake of at least 80 grams weighed under 6 pounds at birth,
their median birth weight being 8 1/2 pounds (3856 grams). In contrast, 47% of the babies born to women who had an average
of less than 45 grams of protein every day were of low birth weight. Among these births, the median bith weight was 5 1/2
pounds.
For every additional 10 grams of dietary protein (up to 85 to 100 grams), the birth weight increased 240 grams (8 1/2 ounces).
Birth size (in terms of both weight and length) increased with every increment of dietary protein. The correlation between
birth length and protein (0.80) and that of the same relationship with the effect of maternal height removed (0,78) were both
significant at the 10-9 level of statistical significance.[18]
Not surprisingly, starvation results in a precipitious decline in birth size. During the siege of Leningrad, U.S.S.R., during
World War II, amenorrhea, a decline in conception, spontaneous abortion, subnormal birth size, and infant morbidity and mortality
increased dramatically as a result of inadequate food rations, severe cold, lack of heat, physical exertion, and other harsh
conditions.[20] Of the 368 of 391 live births in one large clinic in Leningrad (there were 23 stillbirths) who were weighed
during the first half of 1942, 49.1% were of low birth weight. Only 3.6% of the infants weighed over 3500 grams (7 pounds
11 1/2 ounces).
The general improvement in nutrition and other environmental conditions among women who delivered during the second half of
1942 was reflected in their lower incidence of low birth weight and subnormal birth length. Among births during the first
half of the year, 41.2% were under 47 centimeters (18 1/2 inches) in length; only 6.5% of those born during the last six months
of 1942 had a birth length of under 47 centimeters.
The mass starvation period during the winter of 1944-1945 in Holland also caused an increase in the frequency of underweight
babies. Children born during the war weighed an average of 240 grams (8 1/2 ounces) less than prewar babies.[21]
The neonatal mortality rate among infants underweight at birth is 30 times higher than that of infants who weigh more than
5.5 lbs at birth.
Numerous prospective as well as retrospective studies document the direct relationship between nutrition and birth weight.
In a prospective study in which a control group was selected through a random process, supplementation was shown to have
a direct effect on birth weight. The low birth weight incidence among 641 pregnant women who received vitamin and/or protein
supplementation was 6.4%.[22] That of 198 controls was 11.1%.
Tompkins and Wiehl observed that the birth weights of the study group women would have been much higher if a larger number
of women receiving protein supplementation had taken all of their alloted supplements. They declared: "Examination of the
individual records of the patients taking protein supplement only shows that the poor weight status of babies of a few patients,
who took less than half of the intended amount of the protein supplement, was responsible for the low average weight for the
entire group."[22]
Of the women who were provided protein supplements, only 3.23% of the babies weighed less than 6 pounds (2722 grams) at birth.
In comparison, 9.16% of the infants born to those who did not receive protein supplementation were under that weight at birth.
In addition, the average length of gestation was lower among those who received protein and vitamin supplementation than
those whose diets were not supplemented by both protein and vitamins (p<.05). Less than 8% of the women who received both
supplements delivered more than one week before term.
Other studies reveal the significant effects of food supplementation on birth weight. Results from a prospective double-blind
supplementation study have shown a significant effect of protein supplementation is increasing birth weight.[23-24] The average
birth weight of babies born to women who received the protein supplement was 150 grams (5 1/4 ounces) greater than that of
siblings who were born before their mother participated in the food supplementation program.
Another double-blind supplementation study has demonstrated similar results.[25] In this particular study the participants
lived in conditions of abject poverty and were chronically malnourished, the typical prenatal diet consisting of 1500 calories
and 40 grams of protein.[26] Centers provided supplements which consisted of 91 calories, 6.4 grams of protein, and vitamins
and minerals in 100-milliliter containers.[24-25,27] The controls consisted of women who had approximately the same previous
caloric intake and health status and were approximately of the same height as the women in the study group. These women were
given a supplement which consisted of 33 calories, vitamins, and two minerals per 100 milliliters.[24] Throughout the women's
pregnancies the amount of the supplement was measured and recorded. None of the women were informed as to whether they were
given the nutritious supplement or the other one, which served as a placebo.
Low birth weight babies are approximately ten times more likely to be mentally retarded than those of higher birth weight.
Birth weight rose as the maternal caloric intake increased.[24] This relationship was striking even when the authors adjusted
birth weight for maternal height and weight, age, parity, and sex of the infant. Of the 69 women who ingested more than 31,000
supplementary calories, there was not one child who was underweight at birth. Moreover, 19% of these infants' birth weight
was more than 3 1/2 kilograms (7 pounds 11 1/2 ounces). As Table 6 reveals, the incidence of underweight births was nearly
four times as high among women who ingested less than 5,000 supplementary calories as those who consumed at least 20,000 supplementary
calories during pregnancy.
TABLE 6
EFFECT OF SUPPLEMENTATION ON
DECREASING LOW BIRTH WEIGHT INCIDENCE
|
|
|
Amount of Caloric
Supplementation
During Pregnancy
|
Less
Than
5,000
|
5,000
to
19,999
|
At Least
20,000
Calories
|
|
Number of Women
|
82
|
89
|
117
|
|
% Low Birth Weight
|
13.4
|
7.1
|
3.5
|
|
|
|
Unfortunately, the 288 births included in the birth weight analysis excluded cases of prematurity. The finding that supplementation
increased birth weight would have probably been augmented had the premature births been included.
More than 35 years ago [as of 1977], Ebbs et al. documented the beneficial effects of food supplementation and birth weight.[28-29]
The study consisted of 380 pregnant women who were in the second trimester, were reasonably healthy, and agreed to be confined
in a hospital (for dietary administration and observation) until delivery. Thorough dietary histories for the seven-day period
prior to hospital admission were taken. All of the 170 women who were found to be well-nourished were provided nutrition
counseling until delivery. Ninety of the 210 poorly nourished women were selected on an alternate basis to receive food supplementation
until six weeks postpartum;[29] the average duration of supplementation was 4.7 months.[28] None of the remaining poorly
nourished women received supplementation or nutrition guidance.[28-29]
During the study there was little difference between the dietary intake of the 170 women who received nutrition education
and the 90 whose diets were markedly improved by supplementation.
The prematurity (probably low birth weight) rate was significantly lower in the supplemented and good diet groups than in
the groups of 120 poorly nourished women. In fact, the incidence of prematurity was lower among the 90 women who were provided
food supplementation (2.2%) than the well-nourished group of 170 women (3.0%) even though the former women were said to have
been poorly nourished through the first half of pregnancy. The prematurity incidence among the 120 poorly nourished women
who received neither food supplementation nor nutrition education was 8.0%.
A food supplementation program in a low-income Mexican village where chronic malnutrition is rampant resulted in an 8% increase
in birth weight.[30] In addition, during infancy, those born to women whose diets had been supplemented exhibited superior
language development and were more active than other children of comparable age and socioeconomic status.
A recent individualized prenatal nutrition education program had a profound effect in increasing birth weight.[24,31-32]
Two-thirds of the 1,736 participants (less than 5% of those who enrolled in the voluntary program dropped out) had completed
no more than five years of education. All participants were provided extensive nutrition education and multivitamin supplements.
The 1,246 (72% of all participants) who were below the poverty level received food supplementation in the form of milk, eggs,
and oranges. Even though the average length of service in the program was only 18 weeks, the program's director, Agnes Higgins,
was able to enhance the women's nutritional status sufficiently (the average daily protein intake was increased from 68 to
101 grams; that for calories rose from 2,249 to 2,778) to increase birth weight and decrease infant mortality. Greater nutritional
intakes were encouraged for conditions of underweight, previous undernourishment, and stress.
As caloric and protein intakes increased, birth weight rose. The average birth weight among women whose protein intake was
not more than 84% of their determined requirement was 3235 grams (7 pounds 2 ounces); that of women who exceeded their protein
requirements by at least 15% was 3447 grams (7 pounds 10 ounces). The overall low birth weight incidence of 6.8% was significantly
lower than that of other clinic patients who received care and delivered in the same hospital as those in the program (9.04%)
(p<.005). Much more impressive was the low birth weight incidence of 3.3% among women under 18 years of age. Also striking
was the finding that the average birth weight of infants born to women participating in the program who had another child
in the same clinic but did not, in the prior or succeeding birth(s), participate in the nutrition program was significantly
higher than that of their siblings (p<.01).
TABLE 7
LOW BIRTH WEIGHT INCIDENCE
AND DURATION OF PARTICIPATION
|
|
|
Weeks of
Nutrition
Counseling
|
Live
Births
|
Low
Birth Weight
Infants
|
% Low
Birth
Weight
|
|
1-12
|
519
|
51
|
9.83
|
|
13-20
|
499
|
39
|
7.82
|
|
At least 21
|
713
|
29
|
4.07
|
|
All cases
|
1,731
|
119
|
6.87
|
|
|
|
Even when birth weight was adjusted to eliminate the effect of other variables, it was significantly associated with length
of service in the program. Birth weight was not associated with length of service among other public patients at the same
hospital (i.e., the controls). The average birth weight among the 521 women who participated in the program for at least
21 weeks and who received food supplementation was 3381 grams (7 pounds 7 ounces), approximately 100 grams greater than that
among women who went to private obstetricians at the same hospital. The average birth weight among other clinic patients
in the same hospital (the controls) was 3127 grams (6 pounds 14 ounces), about 9 ounces less than the 521 study group women.
A case history of one of the participants unequivocally demonstrates the value of nutrition education and supplementation.
The birth weights of this woman's 11 children, all of whom were delivered at the same hospital, are indicated in Figure 1.
Only during her last three pregnancies was the woman a program participant. Note that the smallest of these infants [when
participating in the program] weighed 1 pound 1 1/4 ounces more than the heaviest of her previous eight births, when she received
no nutrition counseling. There is less than one chance in a billion that the difference between the birth weights during
her first eight pregnancies and those of the last three can be attributed to chance.
| Figure 1 |

|
| Effect of nutrition education and food supplementation on birth weight for mother of 11 |
Grey Bars: No Nutritional Education or Supplementation with first 8 children
Black Bars: Nutrition Education and Supplementation with Last 3 Children
Note from Joy: I also translated this chart into a table, so that you can see it in a different way.
FIGURE 1. Effect of nutrition education and food supplementation on birth weight for mother of 11.
|
|
|
Child
|
Nutrition Education
or Supplementation
|
Approximate
Birth Weight
|
|
First--Female
|
None
|
2,700 grams
(6 pounds)
|
|
Second--Male
|
None
|
2,500 grams
(5 lbs 8 oz)
|
|
Third--Male
|
None
|
1,800 grams
(4 pounds)
|
|
Fourth--Female
|
None
|
2,300 grams
(5 lbs 1 oz)
|
|
Fifth--Female
|
None
|
2,100 grams
(4 lbs 10 oz)
|
|
Sixth--Male
|
None
|
2,800 grams
(6 lbs 3 oz)
|
|
Seventh--Male
|
None
|
2,300 grams
(5 lbs 1 oz)
|
|
Eighth--Male
|
None
|
1,800 grams
(3 lbs 15 oz)
|
|
Ninth--Female
|
Both
|
3,200 grams
(7 lbs 1 oz)
|
|
Tenth--Male
|
Both
|
3,800 grams
(8 lbs 6 oz)
|
|
Eleventh--Female
|
Both
|
3,400 grams
(7 lbs 8 oz)
|
|
|
|
The woman's third child died at the age of one month. A physical and mental assessment of her other seven children born before
she learned of the nutrition program revealed that all of them are impaired neurologically. To date, more than $300,000 of
public funds have been expended for their maintenance and rehabilitation. In contrast, all three children born while the
woman was enrolled in the nutrition program are in good health. The program's cost to provide her nutrition education and
food supplementation was approximately $125 for each of the pregnancies.
Even in the absence of food supplementation, nutrition education, when properly implemented, can result in a marked reduction
in the incidence of underweight babies.
Even a briefer period of food supplementation than that provided in the aforementioned program can substantially increase
birth weight. During the last four weeks of gestation, 25 low-income women were hospitalized so that protein and calorie
supplementation could be administered and monitored.[33] The average daily caloric intake had been increased from 1,400 to
2,100. In addition, all of the women received iron and multivitamin tablets and protein supplementation. Slightly more than
half (13) of the women were placed on a diet which provided 60 grams of protein per day (animal protein comprised 20 grams);
the other 12 women received 90 grams of protein per day (which included 20 grams of animal and 30 grams of dairy protein).
The average daily protein consumption had been 40 grams prior to the study. A control group of 26 women of the same economic
class was utilized for comparison.
When compared to the control group, the food supplementation increased the birth weight by nearly 11 1/2 ounces, from 2704
to 3028 grams [from about 5 lbs 15 1/2 oz, to about 6 lbs 11 oz]. The level of statistical significance applicable to the
difference in birth weights is infinitesimal.
Iyenger theorized that the additional 30 grams of protein among the 12 women did not result in a further significant increase
in birth weight since they did not receive additional calories.[33] Since a 30% deficiency can result in a 60% reduction
in dietary protein being available for tissue synthesis,[34] if the additional protein supplementation had been accompanied
by a somewhat proportional increase in calories, the average birth weight among the 12 women would have been much higher than
that of the 13 other who received only moderate supplementation.
Even in the absence of food supplementation, nutrition education when properly implemented can result in a marked reduction
in the incidence of underweight births. In one such program, the low birth weight incidence among all primigravidas (who
are traditionally considered to be high risk) who delivered in one county during a four-and-one-half-year period was nearly
five times lower than that of primigravidas of similar economic classes. The level of statistical significance reflecting
the reduction in low birth weight is less than one billionth.
TABLE 8
INFLUENCE OF NUTRITION EDUCATION
IN LOWERING RISK OF LOW BIRTH WEIGHT
| |
# of Women
|
% Low Birth Weight
|
|
Infants born to primigravidas
Receiving Nutrition Education
|
321
|
2.8
|
|
Infants born to other primigravidas
Attending same County Clinic
|
1,237
|
13.7
|
Reviewing this dramatic decline in the low birth weight rate resulting from sound nutrition education, the scientific director
of the National Institutes of Child Health and Human Development, National Institutes of Health, attributed the high rate
of underweight births (13.7%) in the control group largely to the fact that many of the control group primigravidas had been
placed on salt-restricted diets and had been told to restrict their weight gain,[35] both of which lead to hypovolemia and
its attendant complications,[36,38-42] and diuretics were prescribed to many.
Referring to the dramatic effects of the nutrition education program, the director declared: "These conclusions challenge
the conventional wisdom, which demands constraint on weight gain by caloric restriction, a limitation of salt intake, and
the use of saline diuretics. None of these were used in the Brewer series...Why is our prematurity rate rising, a factor
of life in no other advanced nation? The answer may well be in our prenatal regimens. It looks as if we can make real progress
on both questions merely by feeding pregnant women."[35]
Birthweight has been shown to be directly related to I.Q. In the mammoth Collaborative Perinatal Study by the U.S. Department
of HEW, 1972, it was found that nearly half of all the children underweight at birth had an I.Q. under 70.
Recognizing the protective effects of applied, scientific nutrition in the 1920's, Toverud reduced the low birth weight incidence
to 2.2% by initiating a "nutrition station" at which 728 women participated.[43] Because of its success, the program was
extended to several hundred additional women. It is especially noteworthy that there were no cases of clinical brain damage
among the more than 1,500 liveborn infants born to women who participated in the program and who also received vitamin K.
Previously, Toverud had reduced the rate of underweight births among 223 unwed others to 2%. The previous incidence among
such women had been greater than 20%.
A well-controlled prospective study in 1944 of the effectiveness of nutrition counseling during the last trimester of pregnancy
resulted in a significant decrease in the low birth weight incidence (p<.05).[45] Among the 500 women who received dietary
counseling during the last three months of pregnancy, 6.2% gave birth to underweight babies. The low birth weight incidence
among the 500 control group women was 10.0%.
Previous to this nutrition counseling study, the authors determined the direct relationship between prenatal nutrition and
infant health by utilizing a retrospective analysis of the diets of the mothers of 300 infants.[45] While hospitalized after
delivery, the mothers of 100 stillbirths, 100 low birth weight infants, and 100 normal weight babies were asked about their
diets during their last trimester. To avoid inherent bias, the authors selected the 300 cases randomly from deliveries at
one hospital.
TABLE 9
INFLUENCE OF NUTRITION
ON SURVIVAL AND WEIGHT AT BIRTH
|
|
|
Calories
or
Nutrient (g)
|
Optimum
Requirements
(As stated by
the Authors)
|
Approximate
Stillbirths
|
Daily Intake
Low
Birth Weight
Infants
|
by Group
Normal-
Weight
Infants
|
|
Calories
|
2,500
|
1,644
|
1,710
|
1,946
|
|
Carbohydrates
|
350
|
207
|
217
|
217
|
|
Fat
|
80
|
61.4
|
64.9
|
80.4
|
|
Protein
|
90
|
52.4
|
54.5
|
72.1
|
|
High-Quality Protein
|
50
|
27.4
|
29.9
|
45.9
|
|
Calcium
|
1.5
|
0.7
|
0.8
|
1.2
|
|
Phosphorus
|
2.0
|
0.9
|
0.9
|
1.4
|
|
Iron (mg)
|
15.0
|
9.0
|
9.0
|
11.0
|
|
|
|
Mothers of the normal weight (defined as 5 1/2 pounds or more) infants, as is shown in Table 9, had been on diets which were
much higher in calories, fat, protein (especially high-quality protein), calcium, phosphorus, and iron than mothers of stillbirths
or low birth weight infants. Moreover, there was little difference in the nutritional intakes of women whose babies were
pronounced dead at birth and those of women who gave birth to underweight infants, although the diets of the women in the
latter group were somewhat superior.
Another retrospective prenatal dietary analysis also depicted the relationship between nutrition and birth weight. Discovering
that protein consumption seemed to be the most accurate indicator of the quality and quantity of the entire diet, Jeans et
al, formed five groups of the 404 women whose diets they analyzed based upon the women's daily protein intake.[46] The low
birth weight incidence of the 177 women who had had less than 60 grams of protein daily was significantly higher than that
of the 227 women who consumed at least 60 grams (4.0%) (p<.02).
Among singletons, the results were even more significant (p<.01), since a set of twins in the best fed group were both underweight.
Their combined weight, however, was over 10 1/2 pounds (4759). More important, there were no stillbirths, neonatal deaths,
or cases of congenital anomalies among the underweight infants born to the 227 best fed women. On the other hand, among the
17 low birth weight infants born to women who had less than 60 grams of protein per day, there was no stillbirth, five neonatal
deaths, and four infants who had congenital anomalies.
Birth weight is much more predictive of a child's susceptibility to sickness and death than is length of gestation.
The Significance of Low Birth Weight
Why is the prevention of underweight births of such critical importance in any public health programs to safeguard infant
health and child development? Hundreds of scientific studies far to voluminous to review herein have demonstrated that birth
weight is the most accurate predictor of health and mental and physical development. Low birth weight infants account for
two-thirds of all neonatal deaths (deaths among liveborn infants which occur within the first 28 days of life).[47] In fact,
low birth weight is the eighth leading cause of death in the U.S.[10] The neonatal mortality rate among infants who were
underweight at birth is 30 times higher than that of infants who weighed more than 5 1/2 pounds at birth.[48]
The authors of the aforementioned prospective nutrition education study among 500 women and those of the retrospective dietary
analysis of 300 women noted:
Neonatal mortality has shown very little improvement. By far the largest factor in these neonatal deaths is prematurity and
of these premature deaths, roughly 50% occur in the first 48 hours. Most of these deaths are among the smallest and most
weakly infants and it is unlikely that medical science even at the cost of more research and the spending of much time and
money will save more than a few of them. A more rational method of approach to the problem would seem to be that of prevention.[45]
The birth weight is much more predictive of a child's susceptibility to morbidity and mortality than is length of gestation.
Figure 2 demonstrates that birth weight is a much more accurate predictor of neonatal mortality than length of gestation.[49]
Note that the mortality rate of neonates who weighed under 2000 grams (4 pounds 7 ounces) at birth is several times higher
than that of those whose birth weight was over 3000 grams (6 pounds 10 ounces).
Margaret and Arthur Wynn wrote:
One official government (Finland) estimate assumes that two children survive so severely and permanently handicapped as to
become a charge to the state for every one who dies, and that reducing the causes of death does on the average reduce the
numbers that are handicapped in the same proportion. Mortality rates are an indicator not only therefore of infant loss but
of infant damage...The prevention of handicaps is much more economic, as well as more humane, than failure to prevent followed
by care services and subsidies to the handicapped.[50]
The Collaborative Perinatal Study confirms the Wynns' estimate. The $100 million study showed that the incidence of definite
neurological impairment of one-year-old children was three and a half times higher among those of low birth weight than among
those of higher weight at birth.[51-52] In the mammoth study, birth weight was shown to be directly related to I.Q. at age
4.[51] More noteworthy, nearly half of all children who were underweight at birth have an I.Q. under 70.[53]

Figure 2. Neonatal mortality risk by birth weight & gestational age. Figures in boxes are percents of babies within
the weight and age ranges of the box that die within the first 28 days after live birth. Especially note that babies born
at term (38-42 weeks) but less than 2,500 grams are more likely to die than pre-term babies born at 30-36 weeks but who weigh
more than 2,500 grams. (Note: 1,000 g = 2.2 lb or 2,500 g = 5.5 lb)
While developmental disabilities are more difficult to associate with low birth weight than infant death because they are
less quantifiable, frequently under reported, and subjective analysis, the former association and that between malnutrition
and developmental disabilities are significant.
Low birth weight babies are approximately ten times more likely to be mentally retarded than those of higher birth weight.[54]
One study of 8- to 10-year-old children showed that abstract verbal reasoning and perceptual/motor integration are more related
to birth weight than they are to I.Q.[55] Approximately 35% to 40% of all low birth weight children have a diagnosable neurological
abnormality by age 7.[56] At the age of 10, two-thirds of those who weighed no more than 1500 grams (3 pounds 5 ounces) at
birth are similarly afflicted.[57]
After reviewing over 150 scientific works and analyzing date from his own studies of the effects of protein/calorie deprivation,
Ben Platt stated:
With the present state of knowledge, it must be accepted that protein-calorie deficiency, with its attendant ills, may lower
maternal efficiency and lead to the production of underweight babies, many of whom will die before reaching two years of age,
whilst among their survivors there will be some who never reach their full physical or mental potential...When all infants
are given equal conditions both within and outside the womb, it is likely that many so-called racial characteristics will
disappear.[34]
The relationship between low birth weight and neurological dysfunction becomes more meaningful when the reliability of proficient
testing of neurologic function in predicting a child's development is considered. In one study the correlation between tests
of neurologic damage given during infancy and those administered more than five years later was 0.70 (p 10-10).[58]
In a subsequent study, neurological assessment was found to be predictive in 94% of the cases among 82 infants, which consisted
of 28 controls, 30 screened normals, and 24 screened abnormals.[58]
Numerous prospective and retrospective studies reflect the high degree of association between low birth weight and subnormal
development. In a study of 187 premature children who all weighed under 1500 grams (3 pounds 5 ounces) at birth, 49.7% had
died within the first year of life.[59] Of the survivors who, at age 10 years, were given a battery of medical, neurological,
psychological, EEG, and other tests, 68% were shown to be handicapped. Central nervous system disorders afflicted 49% of
the children. Multiple handicaps were found among 41%. In addition, the incidence of abnormal EEG results (60%) among them
was ten times higher than that usually found among normal birth weight children.
Because studies of twins (especially monozygotic twins) provide intrinsic controls of genetic and some environmental factors,
they are pertinent to establishing the relationship between birth weight and development. Babson et al. examined development
records of 16 sets of dissimlar-sized twins. In each case the smaller twin weighed less than 2000 grams (4 pounds 7 ounces)
and at least 25% less than the larger twin at birth. I.Q., vocabulary, and language tests, and height, weight, and head circumference
measurements were taken at ages ranging from 4 1/2 to 11 years. None of the examiners were aware of any child being the larger
or smaller twin.
On the average, in all the tests and measurements the lower birth weight twins scored lower than the larger twins. (See Table
10). Four of the smaller twins, in contrast to none of the larger twins, had physical defects.
TABLE 10
ASSOCIATION OF BIRTH WEIGHT
WITH VARIOUS TESTS AND MEASUREMENTS
|
Examination
|
Mean Difference Between the
Higher Birth Weight Twins
and the Lower Birth Weight Twins
|
Significance
Level
|
|
Vocabulary Test
|
2.50
|
ns
|
|
I.Q.
|
6.75
|
p<.05
|
|
Height
|
4.34 cm (1.7 in.)
|
p<.01
|
|
Head Circumference
|
1.34 cm (0.5 in)
|
p<.001
|
|
Weight
|
3.95 kg (7 lb. 15 oz.)
|
p<.001
|
Among the nine monozygotic sets of twins, the mean differences were even greater, as revealed in the following table.
TABLE 11
ASSOCIATION OF BIRTH WEIGHT WITH I.Q.
AND MEASUREMENTS AMONG MONOZYGOTIC TWINS
|
|
|
Examination
|
Mean Difference Between the
Higher Birth Weight Twins
and the Lower Birth Weight Twins
|
Significance
Level
|
|
I.Q.
|
6.56
|
p<.05
|
|
Height
|
5.89 cm (2.3 in.)
|
p<.001
|
|
Head Circumference
|
1.67 cm (0.7 in.)
|
p<.01
|
|
Weight
|
4.81 kg (9 lb. 11 oz.)
|
p<.001
|
|
|
|
A larger study of 370 twelve-year-old children who resided at one psychiatric hospital and 370 controls showed that low birth
weight is also associated with psychological disturbances.[60] The low birth weight incidence was much higher among the hospitalized,
mentally ill children (14.1%) than among the controls (7.8%) (p<.005). In addition, the incidence of organic brain damage
was higher among the study group children.
Many researchers have linked I.Q. and birth weight. A study involving 648 infants in which none of the examiners were aware
of the children's birth weight documented the relationship between birth weight and I.Q., educational advancement, and behavior.[61]
Only 1% of the children (who were tested at ages 7 or 11) who weighed over 5 1/2 pounds had moderate or severe mental, neurological,
or physical handicaps. In contrast, among those whose birth weight was under 1250 grams (2 pounds 12 ounces), 64% had such
abnormalities. The data in Table 12 signify that the probability that birth weight is not related to mental, physical, and/or
neurological impairment is less than one in a billion.
TABLE 12
ASSOCIATION BETWEEN BIRTH WEIGHT
AND RISK OF HANDICAP (514 Cases)
|
|
|
Birth Weight
|
Degree
Moderate
or Severe
|
of
Mild
|
Handicap
Little
or None
|
|
1250 grams
(2 lb, 12 oz)
|
64% (23)
|
17% (6)
|
19% (7)
|
|
1251-1500 grams
(2 lb, 12 oz
to 3 lb, 5 oz)
|
34% (16)
|
21% (10)
|
45% (21)
|
|
1501-1750 grams
(3 lb, 5 oz
to 3 lb, 13.75 oz)
|
19% (5)
|
23% (6)
|
58% (15)
|
|
1751-2000 grams
(3 lb, 13.75 oz
to 4 lb, 6.5 oz)
|
12% (8)
|
30% (20)
|
58% (39)
|
|
2001-2250 grams
(4 lb, 6.5 oz
to 4 lb, 15.5 oz)
|
4% (2)
|
23% (13)
|
74% (42)
|
|
2251-2500 grams
(4 lb, 15.5 oz
to 5 lb, 8 oz)
|
3% (3)
|
16% (19)
|
81% (94)
|
|
2501 grams
(5 lb, 8 oz)
and over
|
1% (2)
|
12% (20)
|
87% (143)
|
|
|
|
Even when controlled by socioeconomic class, I.Q. increased as birth weight rose. Table 13 gives the distribution of I.Q.
centiles by socioeconomic class based upon the I.Q. scores of the children who weighed over 5 1/2 pounds at birth. The expected
distribution of I.Q. scores, assuming there was no relationship between birth weight and I.Q., would be 25% for the lowest
quartile, 50% for the 25th to 75th percentile, and 25% for the highest quartile. For every socioeconomic class there were
more than the expected number of children whose I.Q. was in the lowest quartile and fewer than the expected number of children
whose I.Q. was in the highest quartile.
TABLE 13
INFLUENCE OF BIRTH WEIGHT
ON DISTRIBUTION OF I.Q. SCORES
BY SOCIOECONOMIC STATUS
|
|
|
Socio-
economic
Class
|
I.Q. Centile
|
Birth
2000
and Under
|
Weight (g)
2001-2500
|
|
Middle
|
Under 25th
25th to 75th
Over 75th
Total
|
55% (29)
36% (19)
9% (5)
100% (53)
|
39% (26)
44% (29)
17% (11)
100% (66)
|
|
Working
|
Under 25th
25th to 75th
Over 75th
Total
|
64% (29)
25% (11)
11% (5)
100% (45)
|
36% (28)
47% (37)
18% (14)
100% (79)
|
|
Lower
|
Under 25th
25th to 75th
Over 75th
Total
|
52% (14)
44% (12)
4% (1)
100% (27)
|
48% (15)
45% (14)
6% (2)
100% (31)
|
|
|
|
Even after excluding children who had moderate or severe handicaps, a significant correlation was found between birth weight
and I.Q. at ages 5 to 7. Table 14 shows the relationship between low birth weight and maladjusted behavior among 432 eleven-year-old
children at all socioeconomic classes. Among children who weighed under 2001 grams at birth, 21.7% were found to be maladjusted
in contrast to 8.4% of those who weighed over 2500 grams.
TABLE 14
RELATIONSHIP BETWEEN BIRTH WEIGHT
AND CHILDHOOD BEHAVIOR
BY SOCIAL CLASS
|
|
|
Socioeconomic
Class
|
Total #
of
Children
|
%
Stable
|
%
Unsettled
|
%
Maladjusted
|
|
Birth
Middle
Working
Lower
|
Weight
42
36
28
|
Under
69
47
36
|
2001
24
19
36
|
grams
7
33
29
|
|
Birth
Middle
Working
Lower
|
Weight
71
54
29
|
Over
79
70
45
|
2500
15
20
41
|
grams
6
9
14
|
|
|
|
The author concluded:
The incidence of moderate or severe handicaps increases with decreasing birthweight, particularly at weights of 2000 grams
and under...Mean I.Q. scores...fell with decreasing birthweight in all social groups...This is not due to socio-economic factors,
being equally evident when comparing children of different birthweight reared in the best (sic) homes with those reared in
the worst...There is no evidence that low birthweight children 'catch up' as they become older.[61]
In a study of 50 sets of twins, whose ages ranged from 5 to 15 years, the heavier twin scored, on the average, significantly
higher than the lighter twins.[62] The differences were significant at the .1% level among the 22 sets of identical twins.
For the study, the psychologist administering the I.Q. tests was not aware of any child's birth weight and tested a given
set of twins on the same day to increase the reliability of the scores.
The same author supplemented his previous findings in an analysis of the birth weights of 51 mentally retarded children, all
of whom were at least six years of age at the time of the study.[63] A control group consisted of children whose I.Q.'s were
over 110 and who went to the same school (in which the average I.Q. was 114) as those in the study group. The controls were
matched with the retarded children for sex, age, and area of residence.
TABLE 15
RELATIONSHIP BETWEEN I.Q. AND BIRTH WEIGHT
AMONG 51 RETARDATES AND MATCHED CONTROLS
|
|
| |
Average
I.Q.
|
Average
Birth Weight
|
Average Birth Weight
Exclusive of Low
Birth Weight and/or
Premature Children
|
|
MALES
Retarded
Children
Control
Group
|
70
121
|
3020 grams
(6 lb, 10.63 oz)
(N = 25)
.........(p<.002)
3750 grams
(8 lb, 4.37 oz)
(N = 25)
|
3300 grams
(7 lb, 4.5 oz)
(N = 20)
.........(p<.002)
3830 grams
(8 lb, 7.25 oz)
(N = 24)
|
|
FEMALES
Retarded
Children
Control
Group
|
67
124
|
3020 grams
(6 lb, 10.63 oz)
(N = 25)
.........(p<.002)
3750 grams
(8 lb, 4.37 oz)
(N = 25)
|
3080 grams
(6 lb, 12.75 oz)
(N = 20)
.........(p<.002)
3440 grams
(7 lb, 9.37 oz)
(N = 25)
|
|
|
|
N = Number of Children
Birth weight and I.Q. were significantly associated (p<.002). In none of the cases was the birth weight of any of the 51
retarded children higher than that of his matched control. The probability that such a high correlation is due to chance
(i.e. that there is no association between retardation and birth weight) is infinitesimal. Among the children of normal to
high intelligent, only 3.9% were of low birth weight in contrast to 21.6% among the study group children (p<.01).
Developmental quotient (D.Q.) has also been linked with birth weight. In one study in which 90% of the infants tested had
a D.Q. between 90 and 120, 80% of those with a D.Q. under 80 were low birth weight infants.[64]
Bacola et al. studied low birth weight children to determine the rates of mental retardation, neurological dysfunction, and
respiratory difficulties.[65] Of the 40 children, who were examined at an average age of 4.3 years, 12 weighed between 1000
(2 pounds 3 ounces) and 1250 (2 pounds 12 ounces) grams at birth and 28 weighed between 1250 and 1500 grams (3 pounds 5 ounces).
Among the smaller birth weight children, five (42%) were mentally retarded. Half (20) of the children appeared normal, although
the authors felt that many of them had minimal brain dysfunction.
Most significant, 60% of the children had had respiratory problems while infants. The incidence of respiratory distress syndrome
(RDS), particularly severe RDS, was inversely proportional to birth weight. Since 80% of the deliveries were spontaneous
and cesarean sections were required in only 5% of the cases, the higher rates of RDS, mental retardation, and other neurological
impairment could not be attributed to the period of labor or the delivery process. Among all of the mentally retarded children,
severe RDS or late apnea (breathing difficulties of at least two minutes' duration occurring between a few hours after birth
to two months of age) and/or toxemia of late pregnancy was observed.
TABLE 16
ASSOCIATION BETWEEN BIRTH WEIGHT
AND DEVELOPMENT OF RDS
|
Birth Weight
|
Total #
of
Children
|
Incidence
of RDS
|
Incidence of
Severe RDS
|
|
1250 grams or less
|
12
|
75%
|
42.0%
|
|
Over 1250 grams
|
28
|
32%
|
3.5%
|
TABLE 17
RISK OF MENTAL RETARDATION
AMONG CHILDREN WITH RDS
| |
# of
Children
|
Incidence of Mental
Retardation Among
Children with RDS
|
|
Severe RDS
|
6
|
67%
|
|
Less Severe RDS
|
12
|
8%
|
The relationship between RDS and low umbilical cord protein levels has been well established. Moreover, the causal relationship
between low cord protein level and maternal malnutrition has also been documented. In an aforementioned prospective food
supplementation study, the well-fed women had cord albumin levels significantly higher than those in the malnourished group
(p<.01).[33]
A study of the cord protein levels of 2,200 consecutive births at one hospital revealed the dramatic association between low
cord protein level of 4.6 g/100 ml or less, 17.1% had RDS, whereas only one of the 2,102 infants whose cord level was above
4.6 g/100 ml developed RDS. The probability that the difference is due to chance approaches one over infinity. Nineteen
of the 34 infants (55.9%) who was significantly lower among those who died than the 15 who survived (p<.01). The mean protein
level among the 34 infants with RDS was 3.80 g/100 ml; that of the 2,166 who did not have the disease was 5.91 g/100 ml (p<10-8).
Cord protein was also significantly associated with birth weight, length of gestation, and the occurrence of third-trimester
hemorrhage. Among infants of 28 to 32 weeks' gestation who weighed between 1000 (2 pounds 3 ounces) and 1500 (3 pounds 5
ounces) grams at birth, the mean protein level was 3.8 g/100 ml. Since higher gestational age was found to be associated
with a rise in colloid osmotic pressure, the author inferred that the "plasma proteins of immature infants may be not only
quantitatively deficient but functionally ineffective as well."
The average birth weight among the infants who had RDS was 1570 grams (3 pounds 7 1/2 ounces). The mean length of gestation
among them was 31 weeks. The author noted that the severity of RDS is also related to a decrease in cord protein.
TABLE 18
RISK OF RDS AND CONCOMMITANT MORTALITY BY BIRTH WEIGHT,
CORD PROTEIN LEVELS, AND LENGTH OF GESTATION
|
|
| |
# of
Infants
|
%
With RDS
|
Lvl. of
Signif.
|
%
Mortal.
|
|
Low Birth Weight
|
171
|
17.5
|
|
11.1
|
|
Birth Weight
Over 2500 grams
|
2,039
|
|
p<10-12
|
*
|
|
Cord Protein of
4.6 g/100 ml or less
|
98
|
|
|
20.4
|
|
Cord protein greater than
4.6 g/100 ml
|
2,102
|
|
p<10-12
|
*
|
|
Low Birth Weight and
Low Cord Protein
(4.6 g/100 ml or less)
|
60
|
|
|
30.0
|
|
Normal Birth Weight
and/or normal cord
Protein (at least
4.7 g/100 ml).
|
2,140
|
|
p<10-15
|
*
|
|
Premature (less than
37 weeks' gestation)
and Low Blood Protein
|
58
|
|
|
32.8
|
|
Normal Length of Gestation
and Normal Blood Prot.
|
2,142
|
|
p<10-15
|
*
|
|
|
|
Many clinicians believe that low birth weight infants born at term are more prone to neurological impairment than underweight
premature infants [67] and are more likely to have congenital anomalies.[10] Of 27 underweight infants born at term, 5 died,
1 was deaf, 4 had congenital heart diseases, and 6 were severely mentally retarded.[68] In addition, among the survivors,
nine (41%) were mentally deficient and two (9%) had borderline intelligence. Many of the 27 mothers had nausea, developed
toxemia (which will later be shown to be caused by malnutrition), and/or gained insufficient weight during pregnancy.
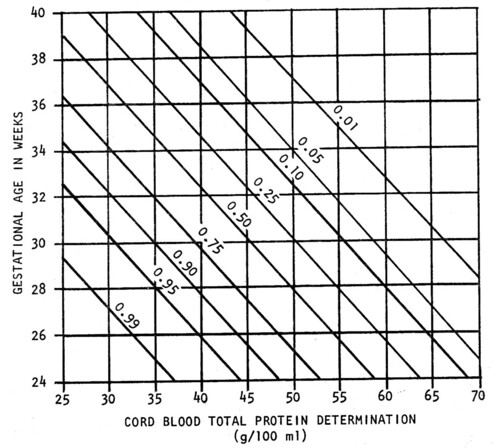
Figure 3. Probability that Respiratory Distress Syndrome (RDS) will develop in a given infant based on determinations of
gestational age and cord blood total protein level as independent variables, with the use of the logistic function.
"If all prospective human mothers could be fed as expertly as prospective animal mothers in the laboratories, most sterility,
spontaneous abortions, stillbirths and premature births would disappear; the birth deformed and mentally retarded babies would
be largely a thing of the past." -- R. Williams, Nutritionist
Effects of Prenatal Nutrition
in Reducing Infant Mortality and Improving Pediatric Health
Decades of scientific research have demonstrated the unequivocal relationship between prenatal nutrition and the condition
of the newborn. This relationship, although complex, is so direct that a deficiency of even one essential nutrient can result
in miscarriage, perinatal death, or the birth of a developmentally disabled child.[69]
A noted nutritionist declared: "If all prospective human mothers could be fed as expertly as prospective animal mothers in
the laboratories, most sterility, spontaneous abortions, stillbirths and premature births would disappear; the birth of deformed
and mentally retarded babies would be largely a thing of the past."[69]
The pernicious effects of malnutrition are most pronounced when near-starvation is imminent. During the 17-month siege of
Leningrad, amenorrhea, failure to conceive, and spontaneous abortion were common in addition to infant morbidity and mortality.[20]
In one large clinic in Leningrad, the number of births declined to 79 during the second half of 1942, corresponding to the
most pronounced period of starvation several months before. During the six-month period two years previous, there were 1,639
births at the same clinic. The small number of births during the entire year of 1942 (439) represented a sharp reduction
from the average number of births during the previous three years of 3,869 (p<10-15).
Also reflecting the pronounced hunger which afflicted women who delivered during the first half of 1942 was the three and
a half times higher rate of stillbirths and neonatal deaths during that period when compared to the rate during the second
half of the year. Among children born in 1942, nearly 89% of them lost weight for more than three successive days after birth.
Nearly 26% of all infants born during the first six months of 1942 died during that period.
The author stated:
Hunger, vitamin deficiency, cold, excessive physical strain, lack of rest, and constant nervous tension had their
effect on the health of the women, the intrauterine development of the fetuses, and the condition of the newborn children
during the siege...The cause of the unusually high proportions of premature births (defined as births under 47 centimeters
in length) and of stillbirths in the first half of 1942 was hunger during pregnancy, that is, the insufficient quantity and
the unsatisfactory quality of the women's food.[20]
In the previously mentioned Harvard study of 216 births, prenatal nutrition was found to be directly related to pediatric
health and reduced infant mortality.[17-19] In this double-blind study neither the obstetricians who evaluated the health
of the infants at birth nor the pediatricians who examined them within the first two days of life were aware of any of the
mothers' nutritional status. In addition, all of the professional examinations were performed independently.
Two-thirds of the infants born to women who had been on poor to very poor diets were stillborn, died within the third day
of life, weighed under five pounds at birth, or had congenital defects.[17,19] Only 8% of the infants born to these women
were determined to be in good or superior condition. On the other hand, only 3% of the infants of mothers who had been on
good or excellent diets were in poor health. Moreover, 94% of them were in superior or good health.
TABLE 19
RELATIONSHIP OF PRENATAL NUTRITION
AND BIRTH WEIGHT TO NEONATAL HEALTH
|
|
| |
Pediatric
Superior
|
Ratings
Good
|
of
Fair
|
Infants
Poor
|
|
Number
of infants
|
23
|
84
|
76
|
33
|
|
Average
Birth
Weight
|
8lb, 2oz
(3685g)
|
7lb,12oz
(3515g)
|
7lb, 2oz
(3232g)
|
5lb, 15oz
(2693g)
|
|
Women on Good
or excellent
Prenatal Diet
|
56%
|
19%
|
1%
|
3%
|
|
Women on Poor
or Very Poor
Prenatal Diet
|
9%
|
2%
|
12%
|
79%
|
|
|
|
Numerous prospective studies provide substantial data reflecting the critical importance of nutrition during pregnancy. Ebbs
showed that food supplementation during the second half of pregnancy results in a marked reduction in reproductive casualty.
In fact, the 90 women who were malnourished during the first half of pregnancy and whose diets were supplemented during the
latter half had lower rates of miscarriage, stillbirths, and premature births (definition not specified) than the 170 women
who had followed sound diets throughout pregnancy.
Table 20, which excludes infants with gross congenital anomalies, demonstrates the relationship between maternal nutrition
and pediatric health at two weeks of age.[20] (Miscarriages and stillbirths are included in the lowest pediatric rating).
Note that nutritional supplementation during the second half of pregnancy eliminated mortality and major infant morbidity,
the incidence of which was 14% among the poorly nourished women.
TABLE 20
INFLUENCE OF DIET IN REDUCING RISK OF
MISCARRIAGE, STILLBIRTH, AND PREMATURE BIRTH
|
|
|
Type of
Diet
|
# of
Women
|
%
Miscarriages
|
%
Stillbirths
|
%
Premature
|
|
Good
|
170
|
1.2
|
0.6
|
3.0
|
|
Supplemented
|
90
|
0.0
|
0.0
|
2.2
|
|
Poor
|
120
|
6.0
|
3.4
|
8.0
|
|
|
|
Among the first 250 babies examined at six months of age, there were three deaths in the poor diet group and none in either
of the well-fed groups.[70] In addition, of these 250 infants, 21% of those born to women in the poor diet group, in contrast
to only 5% of those born to mother in either of the better fed groups, had had frequent colds.[28] Ebbs et al. concluded:
"The application of the principles of nutrition could not be more important in any other period of life than during pregnancy."[70]
A dramatic reduction in mortality was also achieved in the prospective, controlled study of 750 pregnant women.[16] Perhaps
the most revealing finding was that there were no stillbirths and only 3 infant deaths among the infants of the mothers whose
diets were supplemented and who received nutrition education, in contrast to a total of 61 such deaths among the 750 controls.
The author also linked inadequate nutrition, particularly vitamin A deficiency, to spontaneous abortion.
TABLE 21
PRENATAL DIET BY
CONDITION OF BABY AT AGE TWO WEEKS
|
Prenatal
Diet Group
|
Good
|
Condition
Fair
|
of Baby
Poor
|
Bad
|
|
Good
|
72.2%
|
23.8%
|
1.2%
|
3.0%
|
|
Supplemented
|
90.5%
|
9.5%
|
0.0%
|
0.0%
|
|
Poor
|
62.3%
|
23.7%
|
5.3%
|
8.7%
|
More recent prospective studies [as of 1977] have shown similar results which are less dramatic than those in the above-mentioned
study, probably because the food supplementation was of a lesser degree and nutrition education was not provided. In an aforementioned
supplementation study, there were no stillbirths among the 199 women who received the largest amount of supplemented calories.[27]
TABLE 22
EFFECT OF NUTRITION ON REDUCING MODERATELY LOW BIRTH WEIGHT,
STILLBIRTH, AND INFANT MORTALITY
|
|
| |
Study
|
Group
|
Control
|
Group
|
Signif.
Level of
Difference
|
|
Total Number
|
750
|
|
750
|
|
|
|
Births Under
5 lb (2268g)
|
0
|
(0%)
|
37
|
(4.9%)
|
p<10-8
|
|
Stillbirths (rate)
|
0
|
0
|
20
|
26.7
|
p<10-6
|
|
Infant Deaths (rate)
|
3
|
4.0
|
41
|
54.6
|
p<10-7
|
|
|
|
Another study by the same authors documented the effects of nutrition on child development.[27] In this study many of the
671 children (all singletons) received the same type of supplement from 6 to 15 months of age that their mothers had taken
during pregnancy and lactation. The incidence of physical growth retardation (defined as a child's weight being under the
10th percentile) at 15 months of age was two times higher among the 373 children whose mothers received the smallest amount
of caloric supplementation (12.3%) than those born to the 84 women who had the greatest caloric supplementation (6.0%). In
addition, the rate of low phychological test performance was four and a half times as high in the former group (11.0%) as
in the latter (2.4%). These differences were not related to socioeconomic or demographic variables or childhood morbidity.
The authors declared: "Intervention programs (in poor rural populations) designed to reduce infant mortality have generally
focused on the control of infectious diseases through adequate health services and paid little attention to nutrition. These
results demonstrate that nutritional interventions can help to reduce infant mortality."[27]
TABLE 23
MORTALITY BY DEGREE
OF CALORIC SUPPLEMENTATION
|
|
| |
# of
Women
|
First
6 Months
|
More Than 6
But Less
Than 9 Months
|
Over 9 Months
But Less
Than 1 Year
|
|
High Supple-
mentation
|
199
|
3.0%
|
0.9%
|
0.0%
|
|
Low Supple-
mentation
|
454
|
5.3%
|
1.2%
|
0.6%
|
|
|
|
More than 25 years ago [as of 1977], Dieckmann et al. showed that a reduction in spontaneous abortion was significantly associated
with an increase in maternal protein intake (p<.002).[71] In the study, which consisted of 612 pregnant women whose diets
were carefully supervised, there were also significant decreases in low birth weight and infant morbidity with improved dietary
protein.
See here for Part II of "Why Women Must Meet the Nutritional Stress of Pregnancy"
See here for Part III of "Why Women Must Meet the Nutritional Stress of Pregnancy"
21st Century Obstetrics Now! Vol. 2 available here
To Be Continued.......
|
